Minneapolis-Saint Paul International Airport, John Wayne Airport, Orange County and Indianapolis International Airport Rank Highest in Respective Segments
More than three million1 passengers passed through Transportation Safety Administration checkpoints at North American airports on July 7 this year, setting a record for one-day passenger volume. According to the J.D. Power 2024 North America Airport Satisfaction Study,SM released today, such huge volumes of passengers—and all the traffic and rapidly rising prices that come along with them—has not stopped passengers from enjoying their time in airports, evidenced by this year’s overall airport satisfaction scores.
This press release features multimedia. View the full release here: https://www.businesswire.com/news/home/20240918481927/en/

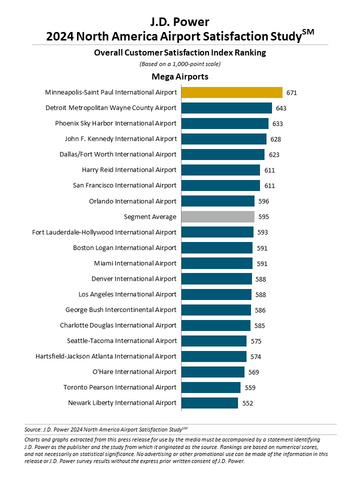
J.D. Power 2024 North America Airport Satisfaction Study (Graphic: Business Wire)
“Huge air travel demand has not slowed down in North America, despite the steadily rising costs of flights, ground travel, hotel rooms and pretty much anything you can buy in an airport,” said Michael Taylor, managing director of travel, hospitality and retail at J.D. Power. “Most travelers are still enjoying the experience. However, we are starting to see a breaking point in consumer spending, with average spend per person in the terminal declining significantly from a year ago.”
Following are some key findings of the 2024 study:
- Airports successfully navigate record passenger volumes: Despite record numbers of passengers and widespread flight cancellations and delays, 60% of North American airport passengers say they “somewhat agree” or “strongly agree” they enjoyed spending time in their airport. Another 59% say they agree that their airport helped to alleviate the stress of travel.
- Rising costs may finally be reaching a breaking point: For many years, the single lowest-scoring attribute in the study has been reasonableness of food and beverage pricing—but it has not really affected passengers’ overall satisfaction. That trend may be ending, however. On average, passengers this year spent $3.53 per person less than they did in 2023 on food, beverage and other items in the terminal. The decline is greatest among large airports where passengers have reduced their spending by an average of $6.31.
- More airports delivering on unique, local identity: One of the key performance indicators separating top-performing airports from those that passengers merely tolerate is unique décor, signage, stores and restaurants that celebrate the region. Overall, 70% of passengers agree their airport reflects a genuine sense of its city or region.
- Crowding has significant effect on airport scores: The average overall satisfaction score when airport terminals are perceived as “not at all crowded” is 736 (on a 1,000-point scale). That score plummets to 429 when terminals are perceived to be “severely crowded.” However, just 5% of passengers say they experienced severely crowded conditions in 2024.
Study Rankings
Minneapolis-Saint Paul International Airport ranks highest in passenger satisfaction among mega airports with a score of 671. Detroit Metropolitan Wayne County Airport (643) ranks second and Phoenix Sky Harbor International Airport (633) ranks third.
John Wayne Airport, Orange County ranks highest among large airports, with a score of 687. Tampa International Airport (685) ranks second and Kansas City International Airport (683) ranks third.
Indianapolis International Airport ranks highest among medium airports for a third consecutive year, with a score of 687. Jacksonville International Airport (686) ranks second and Southwest Florida International Airport (675) ranks third.
The North America Airport Satisfaction Study, now in its 19th year, was redesigned for 2024. Scores in this year’s study are not comparable year over year with previous-year studies. The 2024 North America Airport Satisfaction Study measures overall passenger satisfaction with mega, large and medium North American airports by examining their experience across seven core dimensions (in order of importance): ease of travel through airport; level of trust with airport; terminal facilities; airport staff; departure/to airport experience; food, beverage and retail; and arrival/from airport experience. Mega airports are defined as those with 33 million or more passengers per year; large airports with 10 to 32.9 million passengers per year; and medium airports with 4.5 to 9.9 million passengers per year.
The 2024 study is based on 26,290 completed surveys from U.S. or Canadian residents who traveled through at least one U.S. or Canadian airport and covers both departure and arrival experiences (including connecting airports) during the past 30 days. Passengers evaluated either a departing or arriving airport from their round-trip experience. The study was fielded from August 2023 through July 2024.
For more information about the North America Airport Satisfaction Study, visit http://www.jdpower.com/resource/north-america-airport-satisfaction-study.
See the online press release at http://www.jdpower.com/pr-id/2024104.
About J.D. Power
J.D. Power is a global leader in consumer insights, advisory services, and data and analytics. A pioneer in the use of big data, artificial intelligence (AI) and algorithmic modeling capabilities to understand consumer behavior, J.D. Power has been delivering incisive industry intelligence on customer interactions with brands and products for more than 55 years. The world's leading businesses across major industries rely on J.D. Power to guide their customer-facing strategies.
J.D. Power has offices in North America, Europe and Asia Pacific. To learn more about the company's business offerings, visit JDPower.com/business. The J.D. Power auto-shopping tool can be found at JDPower.com.
About J.D. Power and Advertising/Promotional Rules: www.jdpower.com/business/about-us/press-release-info
1 “TSA Readies for Busiest Labor Day Travel Period on Record,” Transportation Safety Administration, Aug. 21, 2024 https://www.tsa.gov/news/press/releases/2024/08/21/tsa-readies-busiest-labor-day-travel-period-record-provides-top
View source version on businesswire.com: https://www.businesswire.com/news/home/20240918481927/en/
Contacts
Media Relations Contacts
Geno Effler, J.D. Power; West Coast; 714-621-6224; media.relations@jdpa.com
John Roderick; East Coast; 631-584-2200; john@jroderick.com


