


The world’s largest Recreational vehicle (RV) manufacturer THOR Industries Inc. (NYSE: THO) stock, has been on fire, trading up 20% in 2023 as it approaches a key resistance level. It set the bar high after its Q3 2022 earnings beat and continues to outperform its peers Winnebago Industries Inc. (NYSE: WGO), Polaris Inc. (NYSE: PII), and Camping World Holdings Inc. (NYSE: CWH).
While the top and bottom lines continue to decline against tough year-over-year (YoY) comps, margins remain resilient. It's impressive despite inflationary pressures and rising interest rates hampering consumer discretionary purchases. The RV industry skyrocketed during the pandemic as lockdown restrictions, and low-interest rates introduced many newcomers to the RV lifestyle.
However, the industry has been in normalization mode since its record 2021 to early 2022 performance. THOR seems to handle the industry normalization better than its peers. It has successfully aligned its production with the shifting retail backdrop while taking advantage of its variable cost model.
Setting the High Bar
On Dec. 7, 2022, THOR released its fiscal first-quarter 2023 results for November 2022. The Company reported an EPS profit of $2.53 per share, beating consensus analyst estimates for $1.82 by $0.71 per share. However, they are down from $4.34 in the year-ago period. Revenues fell (-21.5%) year-over-year (YoY) to $3.11 billion. The backlog rose 3.1% to $13.88 billion. Profit margin was 15.7% a (-90 bps) drop from the year-ago period.
This was better than the (-300 bps) fall in Winnebago’s earnings which were reported a week after THOR. The Company continued to buy back $35.4 million of stock in the quarter. Fiscal full-year 2023 net sales are expected to come between $11.5 billion and $12.5 billion, with diluted EPS coming in between $7.40 and $8.70.
CEO Commentary
THOR CEO Bob Martin commented, "THOR has a proven track record of demonstrating resilience in economic down cycles, and we expect fiscal 2023 results to be no different. To be sure, inflation and monetary policy driving higher interest rates are impacting the retail environment. THOR is built to perform in these shifting conditions, with an unparalleled track record within the industry.
The current environment is challenging, but it does not diminish the widely-shared, long-term optimism for the industry or for THOR.”
RVIA Expected Wholesale Shipments to Fall in 2023
The Recreational Vehicle Industry Association (RVIA) released its 2022 and 2023 RV wholesale shipments forecast on Dec. 8, 2022. It expects a (-21%) YoY decline in 2023, with shipments expected in the range of 379,000 to 404,000. The industry continues to normalize to pre-pandemic shipment levels.
RVIA president Craig Kirby commented, "The long-term health of the industry remains strong thanks to the droves of younger and more diverse buyers who have entered the RV lifestyle over the past few years." A Baird report indicates RV retail registrations fell (-25%) in November 2022. They expect 2023 RV wholesale shipments from 350,000 to 375,000, or down (-25%) to (-30%).
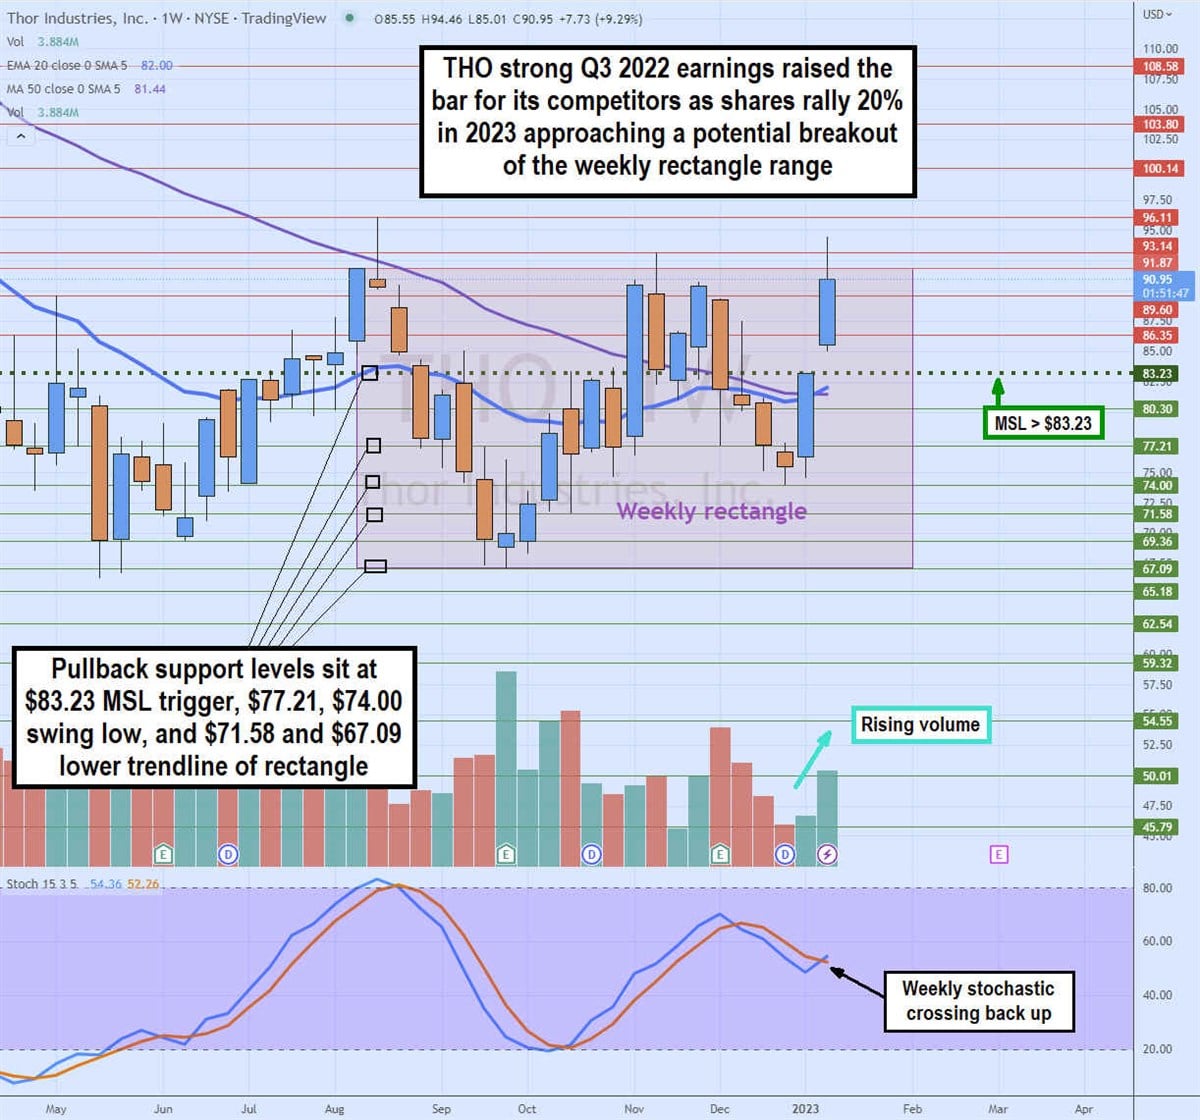
Weekly Rectangle Pattern
THO stock has been in a weekly rectangle trading range since August 2022. It's been trading between the $67.09 low and $91.87 high price range. While shares did manage to briefly breakout through the upper range, the weekly candlesticks have consistently failed to close above the upper range.
The weekly 20-period exponential moving average (MA) at $82.00 has crossed up through the weekly 50-period MA at $81.44, indicating a breakout. The weekly stochastic is also showing a crossover attempt to reignite buying momentum. The weekly market structure low (MSL) buy triggered a gap through the $83.23, which will likely have to be filled or retested.
A weekly candlestick close above $91.87 is needed to get a breakout going. It also needs to follow through with several more green candles. Pullback support areas in the event the breakout fails sit at $83.23 weekly MSL trigger, $77.21, $74.00 weekly swing low, $71.58, and the $67.09 lower trendline of the weekly rectangle.
