


Although the overall market, specifically the technology sector, has faced steady selling pressure over the previous three months, now down about 2% year-to-date, the sector has still outperformed.
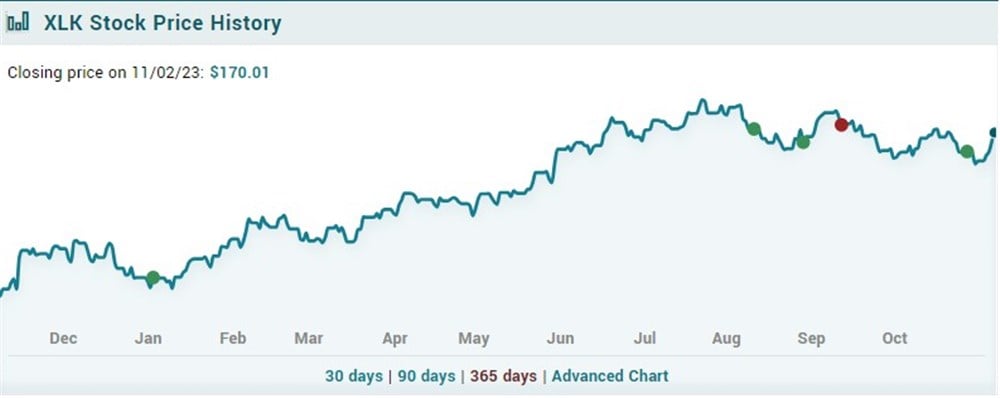
The Technology Select Sector SPDR Fund (NYSE: XLK) stands out as one of the top-performing sector ETFs, up almost 37% year-to-date and 43% over the previous year.
With most of its top holdings having recently reported earnings and the ETF successfully holding above support, the near-term potential bearish catalysts might be out of the way, and the ETF is now edging toward a critical breakout level.
The ETF's top two holdings account for almost 45% of what it owns. Therefore, monitor the sector's ETF and top holdings to draw accurate conclusions.
XLK edges closer to the breakout level
The XLK ETF aims to match the performance of the Technology Select Sector of the S&P 500 Index. The fund passively invests in stocks related to IT consulting, semiconductor equipment, computers, telecommunications and wireless services.
The fund currently has $48.18 billion in assets under management, a dividend yield of 0.76%, slightly higher than the QQQs, and a net expense ratio of just 0.10%.
XLK mainly focuses on U.S. companies, with a 96.5% U.S. geographic exposure. The ETF has a 97.3% exposure to the technology sector, with 37.5% software industry exposure, 26.9% communications equipment industry exposure, and 25.3% semiconductors industry exposure.
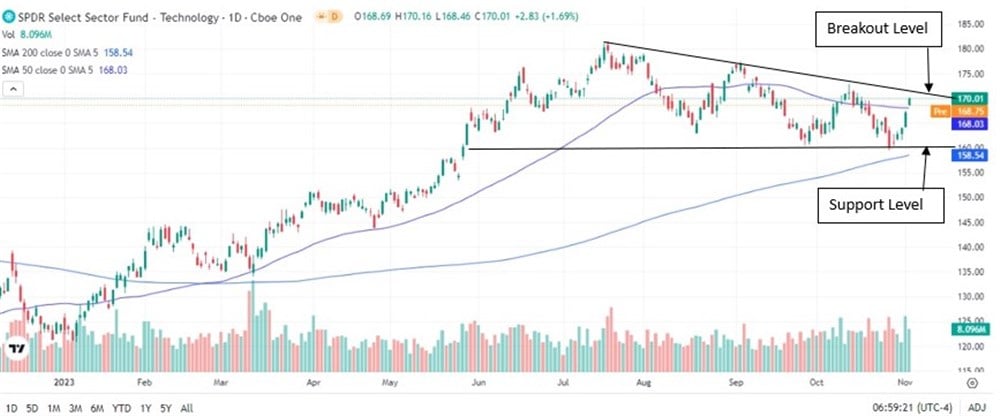
Already up almost 37% year-to-date, the sector ETF shows no signs of slowing down before year's end. Recently, the ETF traded into a critical level of support at $160 but quickly found support and traded back into the high end of the consolidation.
An interesting setup has emerged with a contracting range on a higher timeframe along with contracting key simple moving averages (SMA), such as the 200-day and 50-day. If the XLK can successfully break above its short-term resistance in the low $170s and base higher, a breakout might be confirmed, and continuation to the upside could be expected.
However, as briefly mentioned above, it's not as simple as only looking at the XLK chart. One also needs to familiarize themselves with the ETF's top holdings.
Two stocks account for almost 45% of the weighting in XLK
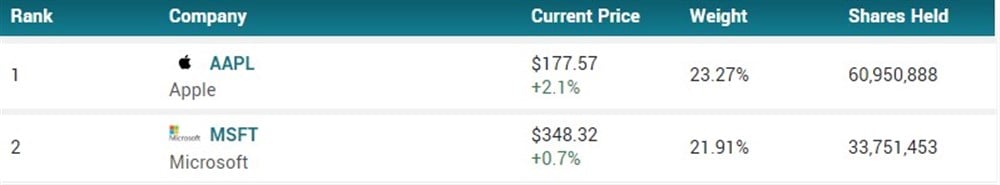
These two blue-chip tech giants' market capitalization means Apple Inc. (NASDAQ: AAPL) and Microsoft Inc. (NASDAQ: MSFT) collectively account for 45.18% of the XLK’s holdings.
As such, movements and developments in their share price could significantly impact the overall direction of the ETF.
Closely monitoring the earnings reports and guidance of the ETF's leading holdings, Microsoft and Apple, is paramount for investors. Key factors to watch:
- Revenue and profit growth
- Product innovation
- Forward guidance
- Their ability to navigate macroeconomic trends
- Dividend and share buyback programs
- The effectiveness of their management teams
By tracking these indicators, you can make informed decisions and leverage the performance of MSFT and AAPL to your advantage within the XLK ETF.
