


Energy drink stocks have been in a growth spurt as more consumers discover them. Like coffee, they can be addictive and habit-forming, especially when they contain nutritious ingredients or have healthy benefits. Many drinks have gone so far as to show clinical studies proving the benefits of improved energy levels, mental alertness and improved metabolic functions. Here are two leading energy drink stocks in the consumer staples sector that can wake up your portfolio even after having stock splits in 2023.
Celsius Holdings Inc. (NASDAQ: CELH)
The science-backed energy drink CELSIUS has six published university studies indicating that the thermogenic properties in its drinks are real. It markets itself as a zero/low calorie, zero sugar healthy functional energy drink that has thermogenic properties to increase metabolism and make the nervous system more active.
This causes the body to burn more fat while the mind stays alert longer. Studies indicate that drinking one Celsius before exercise can effectively help reduce body fat, increase endurance and provide greater resistance to fatigue. In a short period, it has grown to be a leader in the functional beverage category. Even Capitol Hill is “hopped up on Celsius energy drinks," according to MSNBC. Shares completed a 3-for-1 stock split on November 13, 2023.
Thermogenic growth
On November 7, 2023, Celsius reported Q3 2023 EPS of 89 cents, crushing consensus analyst estimates for 51 cents by 38 cents. Revenues surged 104.5% to $384.8 million versus $351.54 million consensus analyst estimates. It's worth noting that we originally covered CELH in 2020 when revenues for Q2 2020 had climbed 86.4% to $30.04 million.
Now they have grown revenues 10X since then. North American revenue rose 108% to $931 million in the first nine months of 2023. Non-GAAP adjusted EBITDA represented 27% of sales, driven by an 860 bps improvement in gross margin to 50.4%, up from 41.8%. Check out the sector heatmap on MarketBeat.
Top market share and expanded distribution
Celsius was the number one selling energy drink on Amazon.com Inc. (NASDAQ: AMZN) with a 21.4% market share in the category for the 14 weeks ended September 30, 2023. Celsius continues to partner with PepsiCo Inc. (NYSE: PEP) for food service distribution and to facilitate ACV expansion. Celsius is available in 3,000 Jersey Mike locations and authorized for over 3,000 Dunkin locations nationwide.
New 16-ounce line launch
The new line of CELSIUS Essential was launched in 16-ounce exclusively at 7-Eleven through 2023, with nationwide rollout expected in 2024. Each can contain 270 milligrams of caffeine and essential amino in four flavors: Blue Crush, Cherry Limeade, Dragonberry and Orangsicle. This line is specifically tailored for fitness enthusiasts to enhance physical performance and gain cognitive benefits.
Celsius Holdings CEO John Fieldly concluded, "Celsius continues to lead both on a dollar and unit growth basis in the energy category. The leverage in our operating model is becoming more apparent with incremental growth, highlighted by our 104% sales growth in the third quarter, delivering over a 300% adjusted EBITDA growth.“
Celsius Holdings analyst ratings and price targets are at MarketBeat. Celsius Holdings peers and competitor stocks can be found with the MarketBeat stock screener.
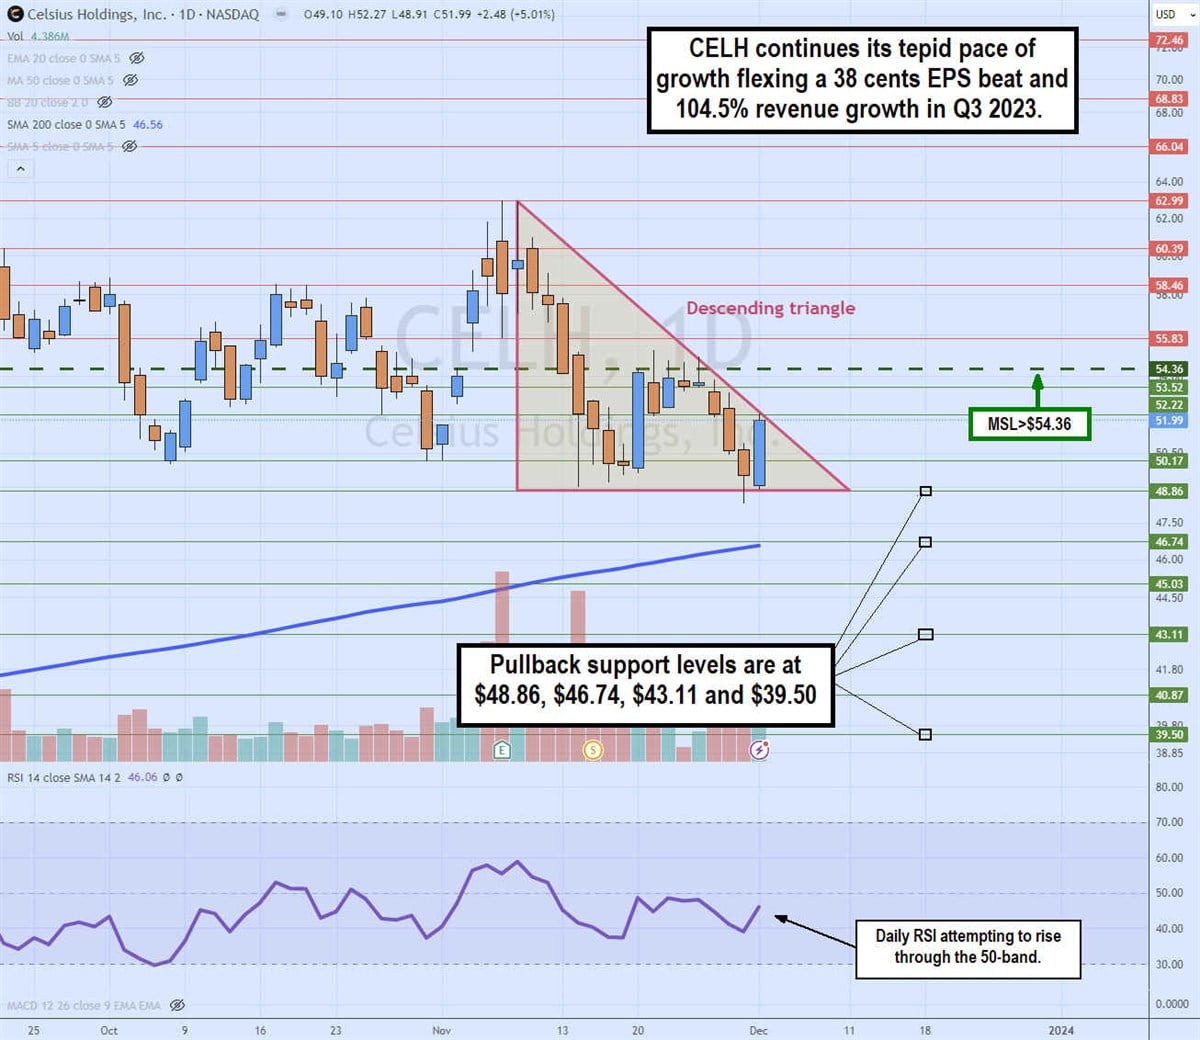
Daily descending triangle
The daily candlestick chart on CELH illustrates a descending triangle pattern comprised of lower highs and a flat-bottom horizontal trendline at $48.86. The descending upper trendline formed at the $62.99 peak on November 8, 2023. The daily market structure low (MSL) breakout forms on the break of the $54.36 trigger. The daily 200-period moving average support is rising at $46.56. The daily relative strength index (RSI) is attempting to bounce through the 50-band. Pullback support levels are at $48.86, $46.74, $43.11 and $39.50.
Monster Beverage Co. (NASDAQ: MNST)
In addition to its flagship Monster Energy brand drinks, it also sells under the Reign, Burn, NOS, Full Throttle, Relentless, Mother, Predator, Bang, CANarchy beer and Tour Water. Its products are sold in over 120 countries throughout North America, Canada, Mexico, Europe, the Middle East and the Asia-Pacific region. The company outsources its manufacturing and maintains strong ties with The Coca-Cola Co. (NYSE: KO), which is also a 16% stakeholder, as its preferred distribution partner. Monster Energy performed a 2-for-1 stock split on March 28, 2023.
Still clawing ahead
On November 2, 2023, Monster reported Q3 2023 EPS of 43 cents, beating consensus analyst estimates for 40 cents by 5 cents. Net income rose 40.4% YoY to $452.7 million, up from $322.4 million in the year-ago period. Revenues grew 14.3% YoY to a record $1.86 billion versus $1.86 billion consensus analyst estimates. Gross margins improved significantly due to lower freight costs, aluminum can costs and pricing actions. Energy drink case sales rose 11% YoY to 203.087 million, with average net sales per case rising 2.1% YoY to $8.90.
Monster Beverage CEO Hans Schlosberg commented, “The energy drink market in the United States, as well as internationally, continues to grow. We are pleased to report another quarter of solid revenue growth, with record sales for our third quarter. Unfavorable foreign currency exchange rates again impacted the quarter.”
Monster Beverage Co. analyst ratings and price targets are at MarketBeat. Monster Beverage Co. peers and competitor stocks can be found with the MarketBeat stock screener.
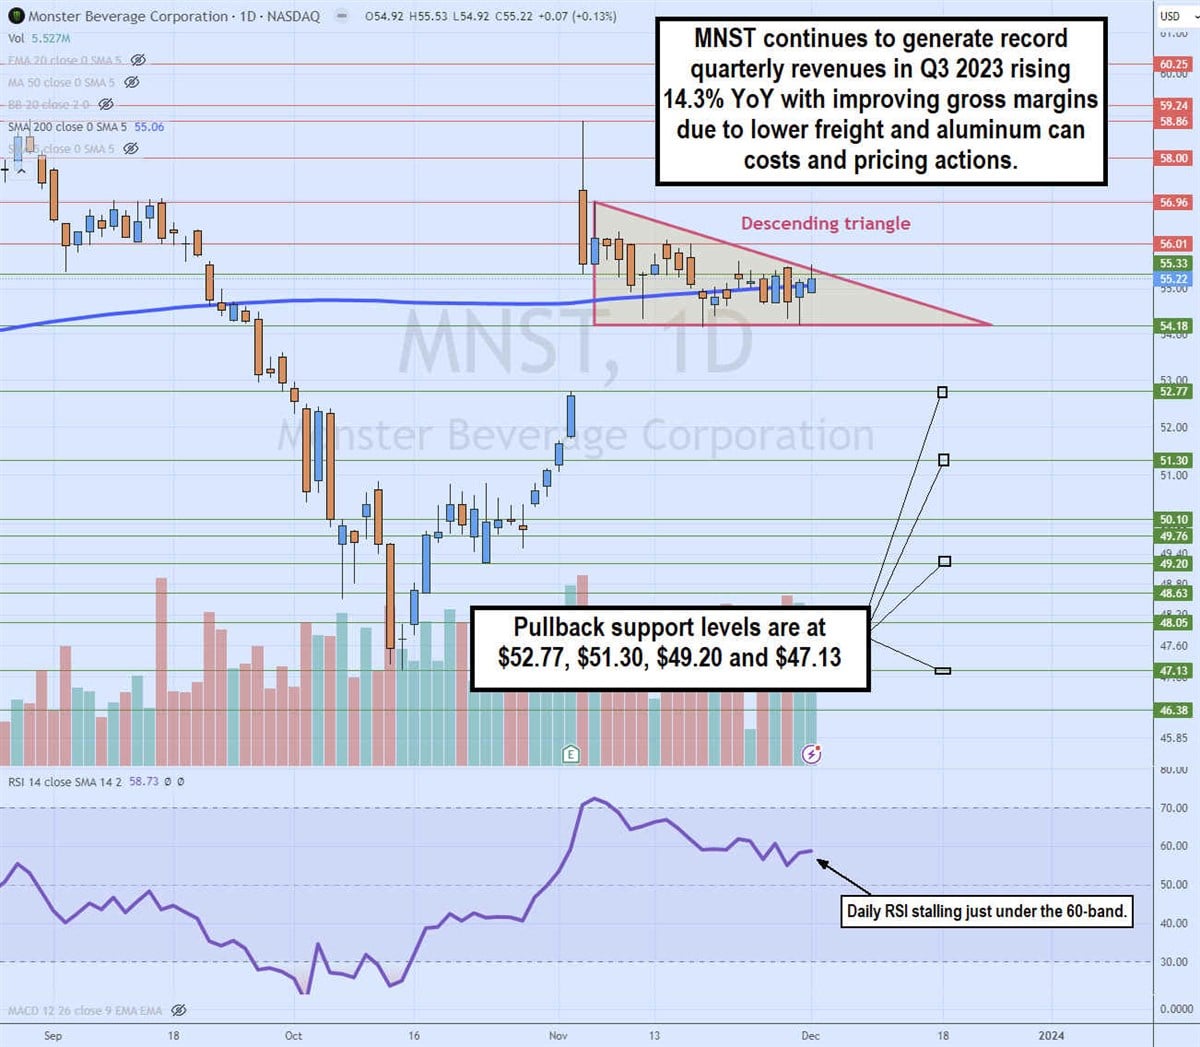
Daily descending triangle pattern
The daily candlestick chart on MNST illustrates a descending triangle pattern that formed on the earnings gap. Shares surged 11% on its Q3 2023 earnings release to a high of $58.86. However, the descending trend line formed as bounces were met with lower highs against the flat bottom support and lower trendline at $54.18.
The daily RSI is stalled and coiled just under the 60-band. A surge can break out MNST through the descending trendline, while a drop can form a gap and fill it back towards the $52.77 level. Pullback support levels are at $52.77, $51.30, $49.20 and $47.13.
