


Splunk (NASDAQ: SPLK) provides a software platform that provides tools for enterprises to perform analytics, management and monitoring of their machine data. It's the security, information, and event management industry leader (SEIM). Gartner ranks it as a top IT observability and events management platform.
Splunk was named a 2022 Forrestor Wave™ Security Analytics Platform Leader. Its core product Splunk Enterprise enables companies to collect, monitor and analyze all IT activities and machine data to improve security, gain insights and troubleshoot problems. Major clients include Airbus, Adobe Inc. (NASDAQ: ADBE), The Coca-Cola Company (NYSE: KO), and Zillow Group Inc. (NYSE: Z).
Competitors
Splunk’s enterprise security and behavior analytics enable companies to detect, analyze and take action against any cybersecurity risks. Its artificial intelligence (AI) and machine learning offerings enable enterprises to gain actionable insights from leveraging its data. It enables companies to engage in customized predictive analytics and implement automation. It offers on-premise and cloud-based access and solutions through subscription and consumption-based revenue models. It competes with various enterprises SEIM companies like Datadog Inc. (NASDAQ: DDOG), International Business Machines Co. (NYSE: IBM), and Elastic NV (NASDAQ: ESTC).
Blowout Quarter
On March 1, 2023, Splunk released its fiscal fourth-quarter 2023 results for the quarter ended January 2023. The company reported earnings-per-share (EPS) profits of $2.04 versus $1.15 consensus analyst estimates, an $0.89 beat. GAAP income was $269 million for the quarter. The GAAP operating margin was 21.3%, and the non-GAAP operating margin was 37.9%.
Revenues grew 38.8% year-over-year (YoY) to $1.25 billion, beating analyst estimates of $1.07 billion. Customers with annual run rates (ARR) over $1 million grew by 115 YoY to 790. For the fiscal full-year 2023, total ARR rose 18% YoY to $3.674 billion as cloud revenue grew 54% YoY to $1.457 billion. Non-GAAP operating margin was 17.6%.
CEO Insights
Splunk CEO Gary Steele commented, “More than ever, Splunk plays a critical role in helping our customers ensure their digital systems are resilient, secure and able to adapt to constant change. As we begin our new fiscal year, we remain committed to delivering durable growth and substantially increasing free cash flow.”
He noted that on-prem and hybrid would be here for the long haul, despite its earlier commitment to cloud migration. The company's research indicates that its advanced digital resilience capabilities saved clients an average of $48 million annually on downtime costs. Demand continues to remain vital for its products. The company is focused on ARR growth as the accurate measure of its performance. Cloud will comprise the majority of ARR by the second half of fiscal 2024.
Cautious Lowered Guidance
Splunk felt it was prudent to be conservative in its fiscal 2024 guidance due to macroeconomic headwinds, deal scrutiny and delayed cloud migrations and expansions. The company lowered its fiscal Q1 2024 and full-year 2024 revenue guidance. It expects fiscal Q1 2024 revenues of $710 million to $725 million versus $803.37 million consensus analyst estimates.
Total ARR is expected to be around $3.7 billion. Fiscal full-year 2024 revenues are expected between $3.85 billion to $3.90 billion versus $4.01 billion analyst estimates. Total annual ARR is expected between $4.125 billion to $4.175 billion.
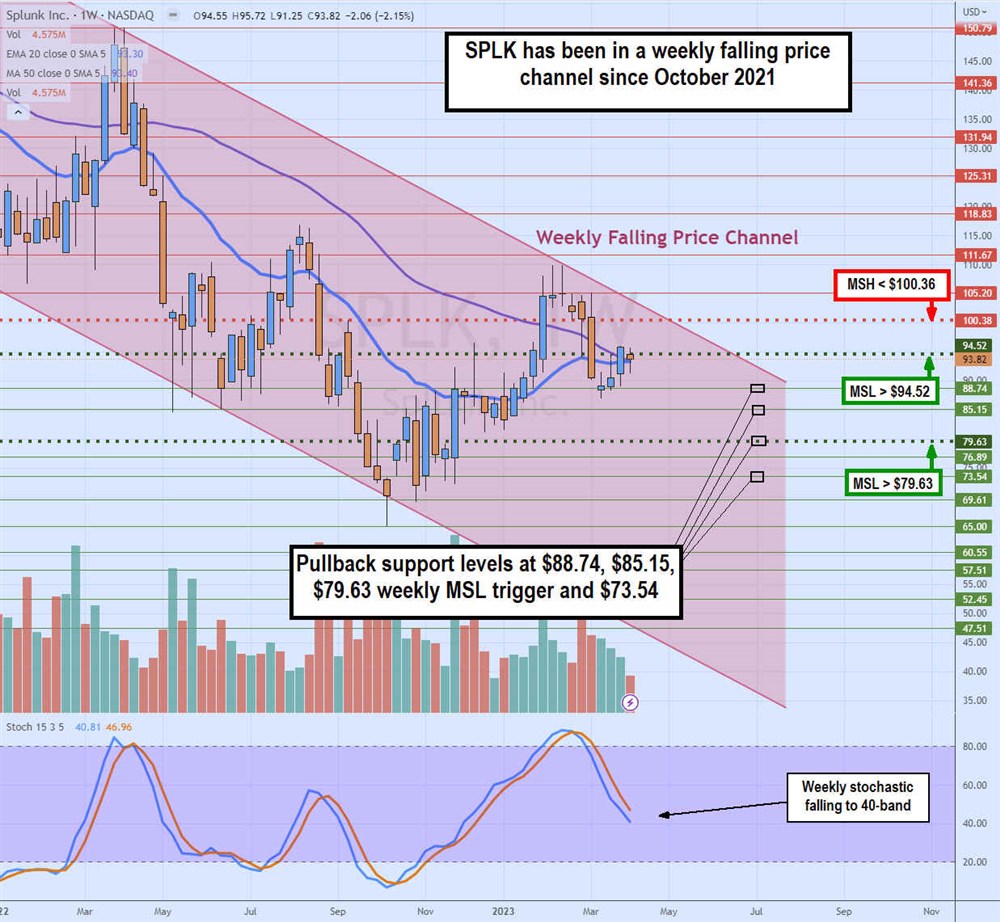
Weekly Falling Price Channel
SPLK shares formed a market structure low (MSL) breakout through $79.63 heading into the March earnings report, which caused shares to sink through the market structure high (MSH) level at $100.38 after lowering fiscal 2024 guidance—a second MSL trigger formed on a breakout through $94.52. The weekly candlestick chart illustrates a falling price channel that has been ongoing since October 2021. The weekly stochastic has fallen to the 40-band since the pre-earnings run-up.
The weekly 20-period exponential moving average (EMA) overlaps with the 50-period MA at $93.35, acting as a potential support when shares trade above and a potential resistance when shares trade below that level. Pullback support levels are $88.74, $85.15, $79.63 weekly MSL and $73.54.
