


In the early days of 2024, the SPDR S&P 500 ETF Trust (NYSE: SPY) is soaring near its all-time high, primarily driven by the impressive rally in the technology sector. Over the past month, it has surged by over 1.5%, firmly establishing itself in positive territory for the year after a somewhat lackluster start. Remarkably, the market has marked a substantial 25% increase from its 52-week low.
However, a stark contrast is evident when we shift our focus to the energy sector, which has experienced significant changes since the start of the new year. The Energy Select Sector SPDR Fund (NYSE: XLE) recently breached a crucial support level near $80, resulting in a nearly 5% decline year-to-date. This decline places it almost 15% below its 52-week high.
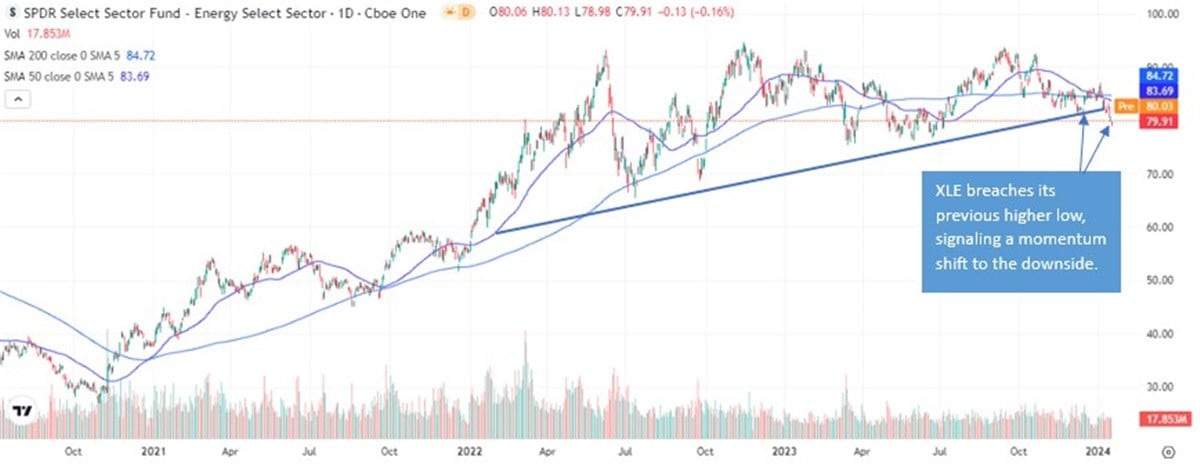
At first glance, capital has shifted away from sectors like energy and utilities and redirected toward the technology sector. This prompts the question: will the energy sector, represented by XLE, continue its underperformance throughout the year? To begin answering that question, several factors need to be considered.
When analyzing the energy sector, it's crucial to remember that it is subject to diverse influences. Factors such as OPEC decisions, molding global oil supply and prices, and geopolitical tensions in oil-producing regions capable of disrupting supplies play pivotal roles. A potential investor in the sector must be updated with the recent headlines and developments to make an informed decision.
Moreover, when scrutinizing the sector, particularly the XLE, it is essential to identify and analyze the major players and top holders of the sector ETF. Due to their sector dominance and ETF weighting, these companies wield significant influence over the overall direction and sentiment of the sector. So, let’s look at how its top three holdings have shaped up so far in the year.
Exxon Mobil (NYSE: XOM)
XOM leads the ETF with a 21.11% weighting. The stock, which was previously in an impressive uptrend along with the sector, has fallen over 3% since the beginning of the year. The shift in trend and momentum occurred in November last year, when the stock broke below its rising 200-day Simple Moving Average(SMA), signaling a significant trend break. With the stock down double-digits over the quarter, it remains in a firm downtrend, below its declining key moving averages. Despite the sector's weakness and underperformance, analysts have remained bullish. The stock has a moderate buy rating and price target forecasting over 30% upside.
Chevron (NYSE: CVX)
CVX is the ETF's second-largest holding, with an 18.52% weighting. It features an impressive 4.26% dividend yield and a 10.53 P/E ratio. CVX is a popular ticker, landing itself on the Trending Stocks List, and its impressive dividend yield earned it a place on the Top-Rated Dividend Stocks List. However, similar to XOM, the stock has declined since November, falling over 15% over the quarter. A key area to watch going forward in CVX and potentially impacting the overall sector is $140. This area is a significant support zone; failure to hold above it could spark further downside.
Schlumberger (NYSE: SLB)
SLB is the ETF's third-largest holding with a 5.38% weighting. The company has a smaller market cap of $69 billion and a lower dividend yield of 2.06% compared to the top two holdings. Despite the smaller dividend and underperformance over the last three months, down 19%, it is a Top-Rated dividend stock and Top-Rated Stock. Analysts have SLB as a Buy, based on thirteen analyst ratings. Impressively, its consensus price target of $70.36 forecast a whopping 45% upside for the stock. However, the stock is in a firm downtrend like the overall sector, below its declining key moving averages. Should the stock bounce, a key area to watch is near $53, where several key SMAs are now beginning to converge.
