


Zoom Video Communications Inc. (NASDAQ: ZM) has been trying to work through normalization after its monstrous pandemic surge in 2021. In the following post-COVID years, Zoom Video has been struggling to stabilize its business and stock price, attempting to find a baseline so it can resume its growth.
Critics have argued that Zoom was a fad during the pandemic, and its utility will be minimized as people return to work. Its fiscal Q4 2025 earnings report illustrates that normalization may finally be complete, and growth is kickstarting again. Most importantly, it continues to prove that Zoom Video is not a fad but a stalwart component in the new era of hybrid and remote work. It competes with computer and technology sector giants like Adobe Inc. (NASDAQ: ADBE), Salesforce Inc. (NYSE: CRM) and Microsoft Co. (NASDAQ: MSFT) for enterprise dollars.
Driving Enterprise Customer Growth
While Zoom Video has seen social engagements fall due to the lifting of social distancing mandates, the company has been able to grow its enterprise customers. The communications platform has evolved with functionality catering to businesses with hundreds of added features. Zoom has integrated artificial intelligence (AI) features like AI-powered meeting transcription and summaries, as well as speaker identification and non-verbal cue detection. Major customers include Broadcom Inc. (NASDAQ: AVGO), Diageo plc (NYSE: DEO) and Convera. Enterprise revenues rose 5% YoY in its recent earnings report. Check out the sector heatmap on MarketBeat.
Evidence That Growth is Returning
Zoom Video reported fiscal Q4 2024 EPS of $1.42, beating analyst estimates by 27 cents. Revenues rose 2.6% YoY to $1.15 billion versus $1.13 billion consensus estimates. GAAP income from operations was $168.5 million compared to a loss of $129.9 million in the year-ago period. Non-GAAP income was $443.7 million, compared to $404.8 million in the year-ago period. The GAAP operating margin was 14.7%, and the non-GAAP margin was 38.7%. Total cash, cash equivalents and marketable securities was $7 billion as of January 31, 2024. Zoom Video authorized a $1.5 billion stock buyback of its Class A common stock.
The Company is Showing Impressive Growth Metrics
Zoom Video had 220,400 enterprise customers at the end of the year. The trailing 12-month net dollar expansion rate for enterprise customers was 101%. Online average monthly churn was 3% in the fourth quarter, down 40 bps YoY. Zoom saw 3,810 customers contributing more than $100,000 in a trailing 12-month revenue growth, up 9.8% YoY. Get AI-powered insights on MarketBeat.
Zoom Raises Its Guidance
Zoom Video raised its guidance for fiscal Q1 2025 with EPS between $1.18 to $1.20 versus $1.13 consensus analyst estimates. Revenues are expected around $1.125 billion versus $1.13 consensus estimates. Fiscal full-year 2025 EPS is expected to be between $4.85 to $4.88 versus $4.66 consensus estimates. Revenues are expected to be around $4.60 billion versus $4.64 billion.
Zoom Video CEO Eric Yuan commented, "In FY24, we unveiled Zoom AI Companion, our generative AI digital assistant, aimed at boosting productivity, enhancing team effectiveness, and fostering skill development across the Zoom platform. We're committed to democratizing AI accessibility, offering it to all our customers regardless of business size, included at no extra charge with a paid license."
Yuan concluded, "Our team is dedicated to platform-wide innovation, introducing hundreds of new features, including those for Zoom Contact Center, which redefine the gold standard for customer experience."
Zoom Video Communications analyst ratings and price targets are at MarketBeat. Zoom Video Communications peers and competitor stocks can be found with the MarketBeat stock screener.
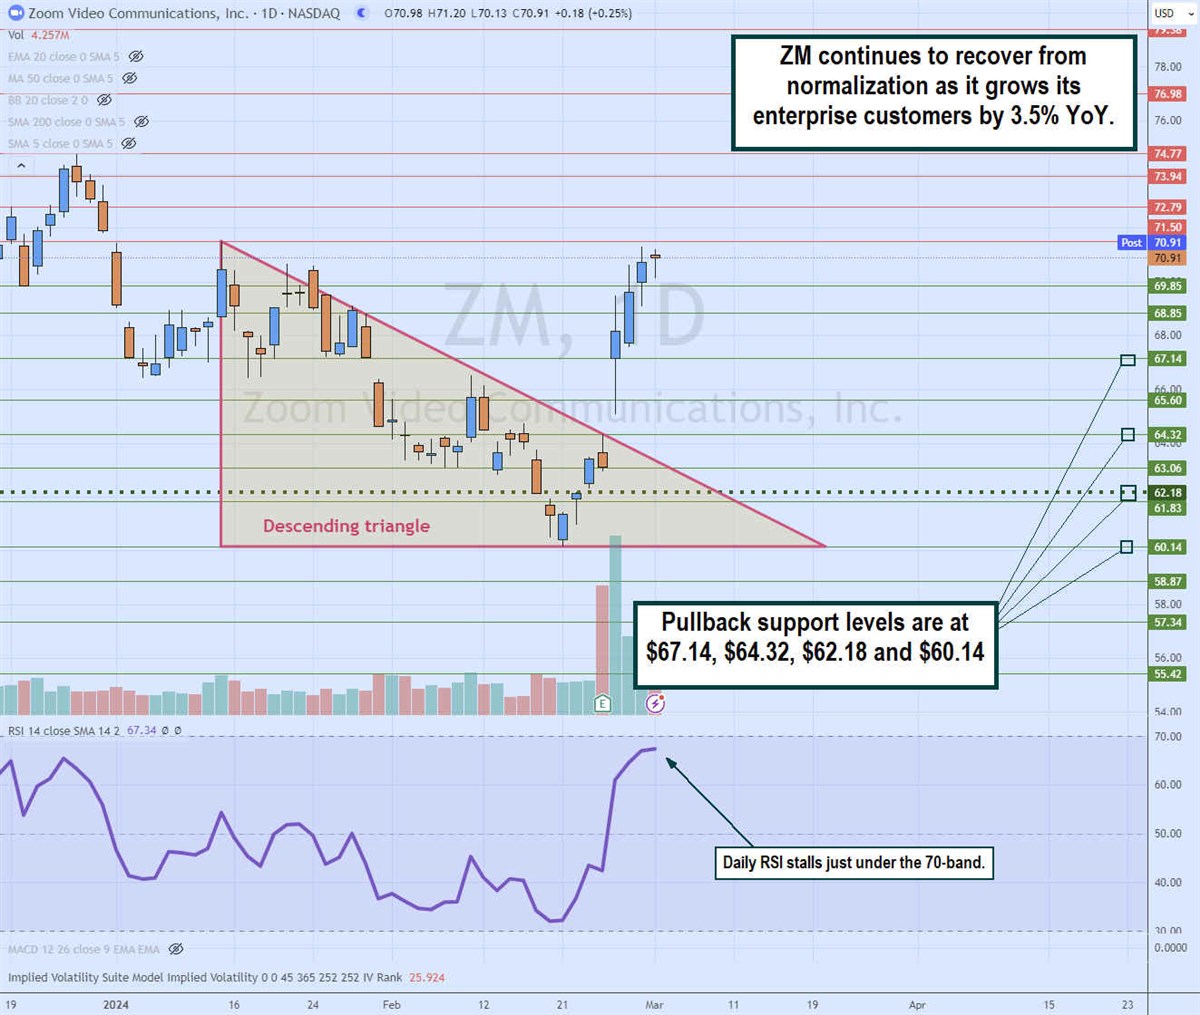
Daily Descending Triangle Breakout
The daily candlestick chart on ZM illustrates a descending triangle breakout pattern. The descending trendline started at the $71.50 peak on January 12, 2024. ZM proceeded to sell off from there, with each bounce attempt being capped at lower highs. The flat-bottom lower trendline sits at $60.14. The daily market structure low (MSL) breakout triggered the $62.18 trigger break. ZM closed at $64.32, heaving into fiscal Q4 2024 earnings, which resulted in a gap up to the $65.06 level, and continued buying, taking it up towards the $71.50 swing high. The daily relative strength index (RSI) bounced towards the 70-band, where it stalled. Pullback support levels are at $67.14, $64.32, $62.18 and $60.14.
