


RV Manufacturer Winnebago (NYSE:WGO) missed Wall Street’s revenue expectations in Q3 CY2024, with sales falling 6.5% year on year to $720.9 million. The company’s full-year revenue guidance of $3.05 billion at the midpoint also came in 4.8% below analysts’ estimates. Its non-GAAP profit of $0.28 per share was also 69.9% below analysts’ consensus estimates.
Is now the time to buy Winnebago? Find out by accessing our full research report, it’s free.
Winnebago (WGO) Q3 CY2024 Highlights:
- Revenue: $720.9 million vs analyst estimates of $730.4 million (1.3% miss)
- Adjusted EPS: $0.28 vs analyst estimates of $0.93 (-$0.65 miss)
- EBITDA: $28.7 million vs analyst estimates of $49.18 million (41.6% miss)
- Management’s revenue guidance for the upcoming financial year 2025 is $3.05 billion at the midpoint, missing analyst estimates by 4.8% and implying 2.6% growth (vs -14.5% in FY2024)
- Adjusted EPS guidance for the upcoming financial year 2025 is $3.75 at the midpoint, missing analyst estimates by 30.3%
- Gross Margin (GAAP): 13.1%, down from 16.5% in the same quarter last year
- EBITDA Margin: 4%, down from 9.5% in the same quarter last year
- Free Cash Flow Margin: 4.1%, down from 15.9% in the same quarter last year
- Market Capitalization: $1.68 billion
“Winnebago Industries’ fourth quarter performance fell short of our expectations, primarily reflecting the sluggish retail demand environment and operating inefficiencies within our Winnebago branded businesses,” said Michael Happe, the Company’s President and Chief Executive Officer.
Company Overview
Created to provide high-quality, affordable RVs to the post-war American family, Winnebago (NYSE:WGO) is a manufacturer of recreational vehicles, providing a range of motorhomes, travel trailers, and fifth-wheel products for outdoor and adventure lifestyles.
Automobile Manufacturers
Much capital investment and technical know-how are needed to manufacture functional, safe, and aesthetically pleasing automobiles for the mass market. Barriers to entry are therefore high, and auto manufacturers with economies of scale can boast strong economic moats. However, this doesn’t insulate them from new entrants, as electric vehicles (EVs) have entered the market and are upending it. This has forced established manufacturers to not only contend with emerging EV-first competitors but also decide how much they want to invest in these disruptive technologies, which will likely cannibalize their legacy offerings.
Sales Growth
Reviewing a company’s long-term performance can reveal insights into its business quality. Any business can have short-term success, but a top-tier one sustains growth for years. Over the last five years, Winnebago grew its sales at a decent 8.4% compounded annual growth rate. This shows it was successful in expanding, a useful starting point for our analysis.
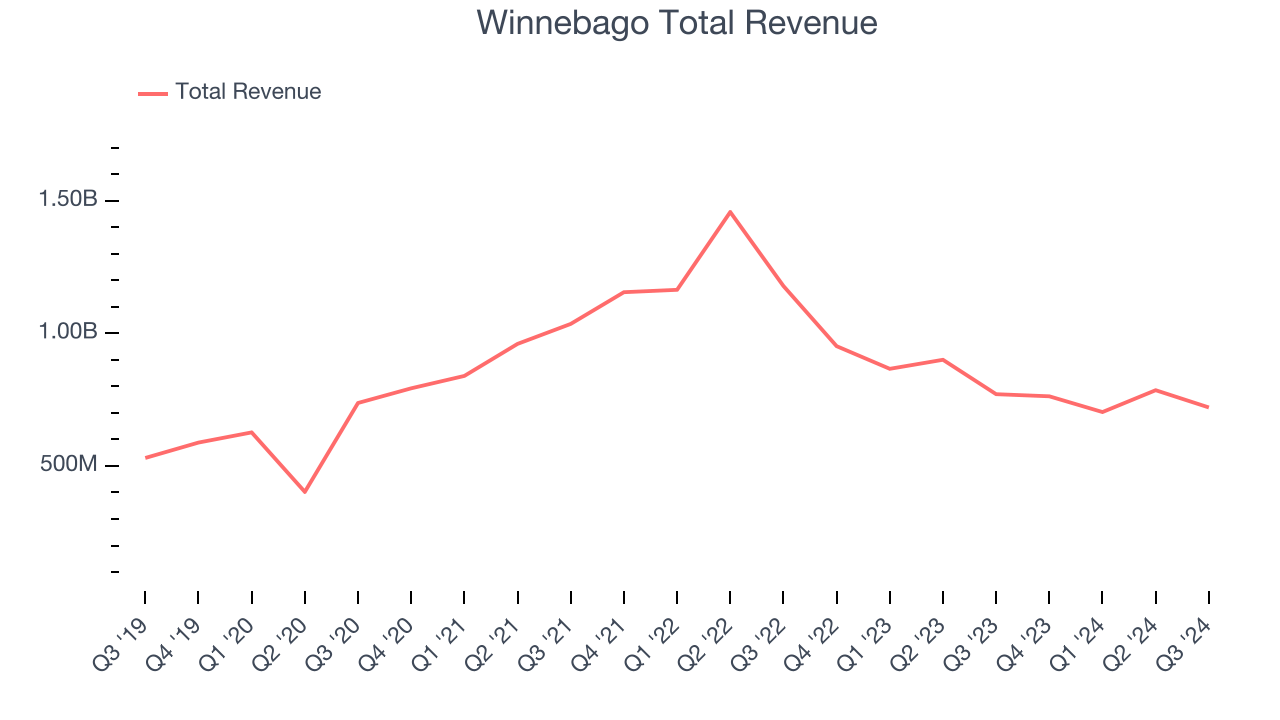
Long-term growth is the most important, but within industrials, a half-decade historical view may miss new industry trends or demand cycles. Winnebago’s recent history marks a sharp pivot from its five-year trend as its revenue has shown annualized declines of 22.6% over the last two years. Winnebago isn’t alone in its struggles as the Automobile Manufacturers industry experienced a cyclical downturn, with many similar businesses seeing lower sales at this time.
Winnebago also breaks out the revenue for its most important segments, Motorhomes and Towables, which are 42.7% and 44% of revenue. Over the last two years, Winnebago’s Motorhomes revenue (homes on wheels) averaged 16.4% year-on-year declines while its Towables revenue (non-motorized vehicles) averaged 25.6% declines.
This quarter, Winnebago missed Wall Street’s estimates and reported a rather uninspiring 6.5% year-on-year revenue decline, generating $720.9 million of revenue.
Looking ahead, sell-side analysts expect revenue to grow 7.8% over the next 12 months, an acceleration versus the last two years. This projection is above average for the sector and indicates the market believes its newer products and services will fuel higher growth rates.
Here at StockStory, we certainly understand the potential of thematic investing. Diverse winners from Microsoft (MSFT) to Alphabet (GOOG), Coca-Cola (KO) to Monster Beverage (MNST) could all have been identified as promising growth stories with a megatrend driving the growth. So, in that spirit, we’ve identified a relatively under-the-radar profitable growth stock benefitting from the rise of AI, available to you FREE via this link.
Operating Margin
Analyzing the trend in its profitability, Winnebago’s annual operating margin decreased by 1.5 percentage points over the last five years. Even though its margin is still high, shareholders will want to see Winnebago become more profitable in the future.
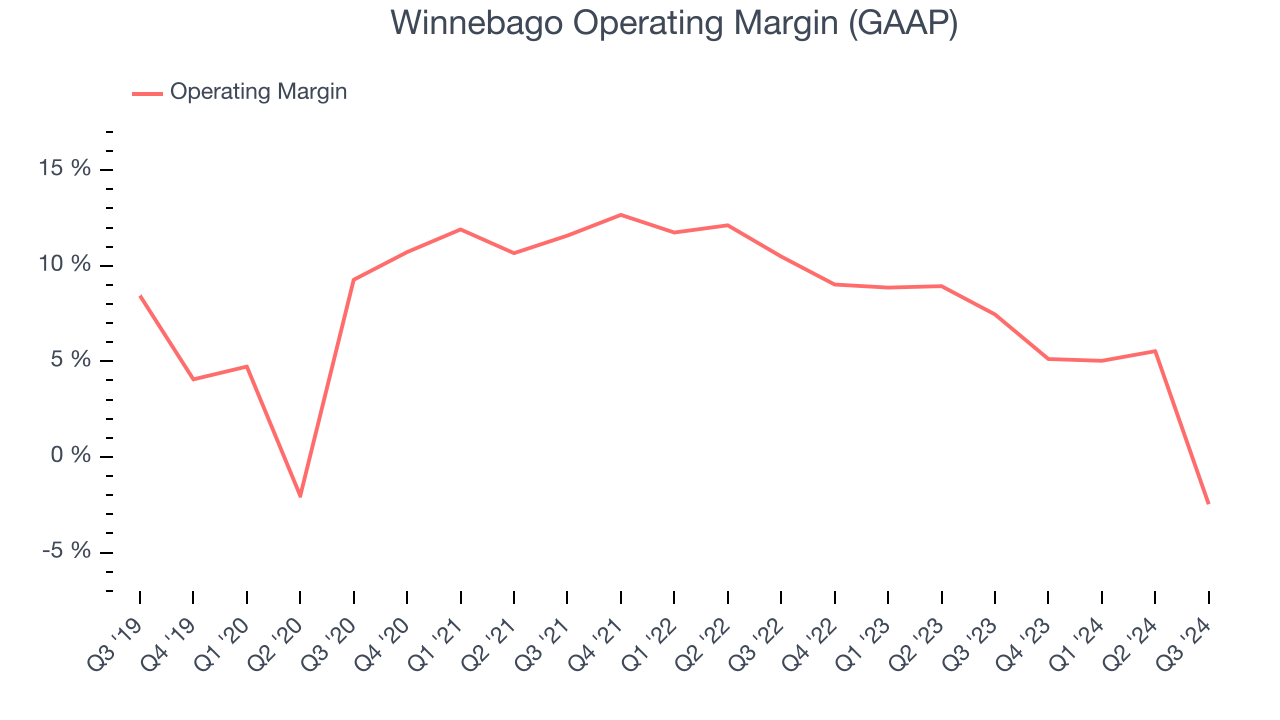
This quarter, Winnebago generated an operating profit margin of negative 2.5%, down 9.9 percentage points year on year. Since Winnebago’s operating margin decreased more than its gross margin, we can assume it was recently less efficient because expenses such as marketing, R&D, and administrative overhead increased.
Earnings Per Share
Analyzing long-term revenue trends tells us about a company’s historical growth, but the long-term change in its earnings per share (EPS) points to the profitability of that growth – for example, a company could inflate its sales through excessive spending on advertising and promotions.
Winnebago’s flat EPS over the last five years was below its 8.4% annualized revenue growth. This tells us the company became less profitable on a per-share basis as it expanded.
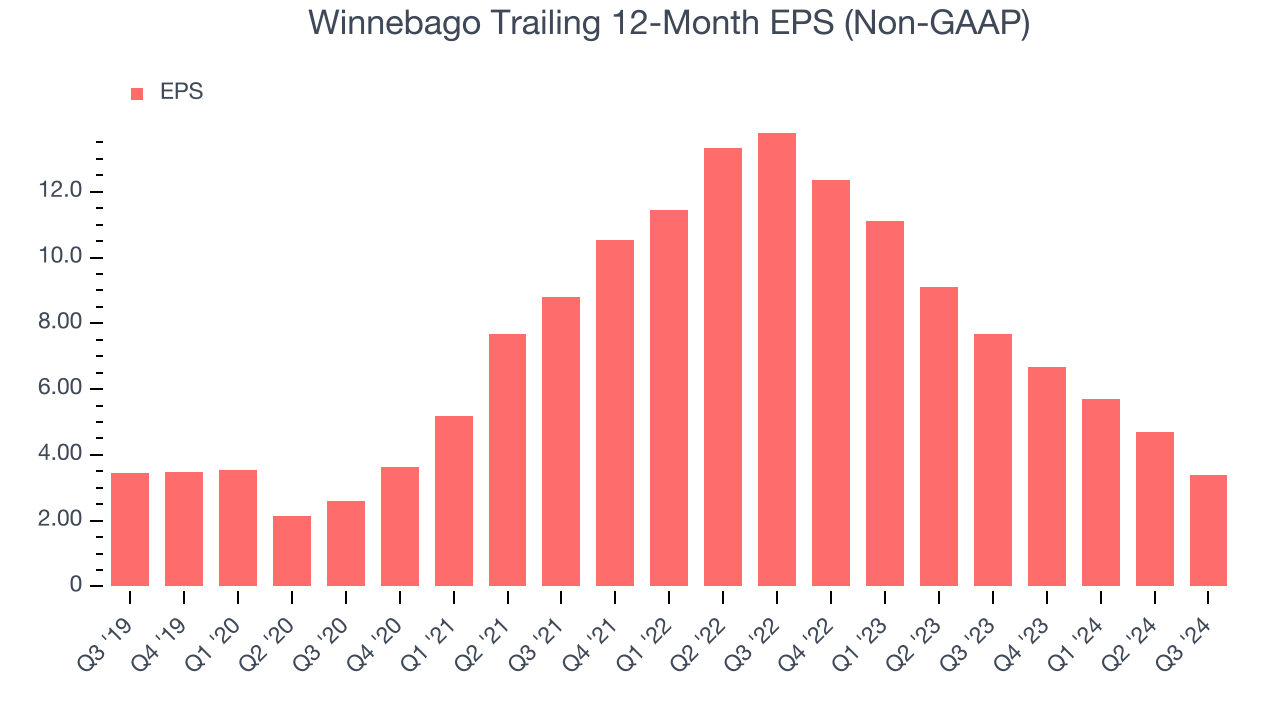
Diving into the nuances of Winnebago’s earnings can give us a better understanding of its performance. As we mentioned earlier, Winnebago’s operating margin declined by 1.5 percentage points over the last five years. This was the most relevant factor (aside from the revenue impact) behind its lower earnings; taxes and interest expenses can also affect EPS but don’t tell us as much about a company’s fundamentals.
Like with revenue, we analyze EPS over a shorter period to see if we are missing a change in the business. For Winnebago, its two-year annual EPS declines of 50.4% show its recent history was to blame for its underperformance over the last five years. These results were bad no matter how you slice the data.
In Q3, Winnebago reported EPS at $0.28, down from $1.59 in the same quarter last year. This print missed analysts’ estimates. Over the next 12 months, Wall Street expects Winnebago’s full-year EPS of $3.40 to grow by 57.9%.
Key Takeaways from Winnebago’s Q3 Results
We struggled to find many strong positives in these results. Its full-year revenue guidance missed and its EPS guidance for the full year fell short of Wall Street’s estimates. Overall, this quarter could have been better. The stock traded down 7.9% to $53.49 immediately after reporting.
Winnebago didn’t show it’s best hand this quarter, but does that create an opportunity to buy the stock right now?When making that decision, it’s important to consider its valuation, business qualities, as well as what has happened in the latest quarter. We cover that in our actionable full research report which you can read here, it’s free.
